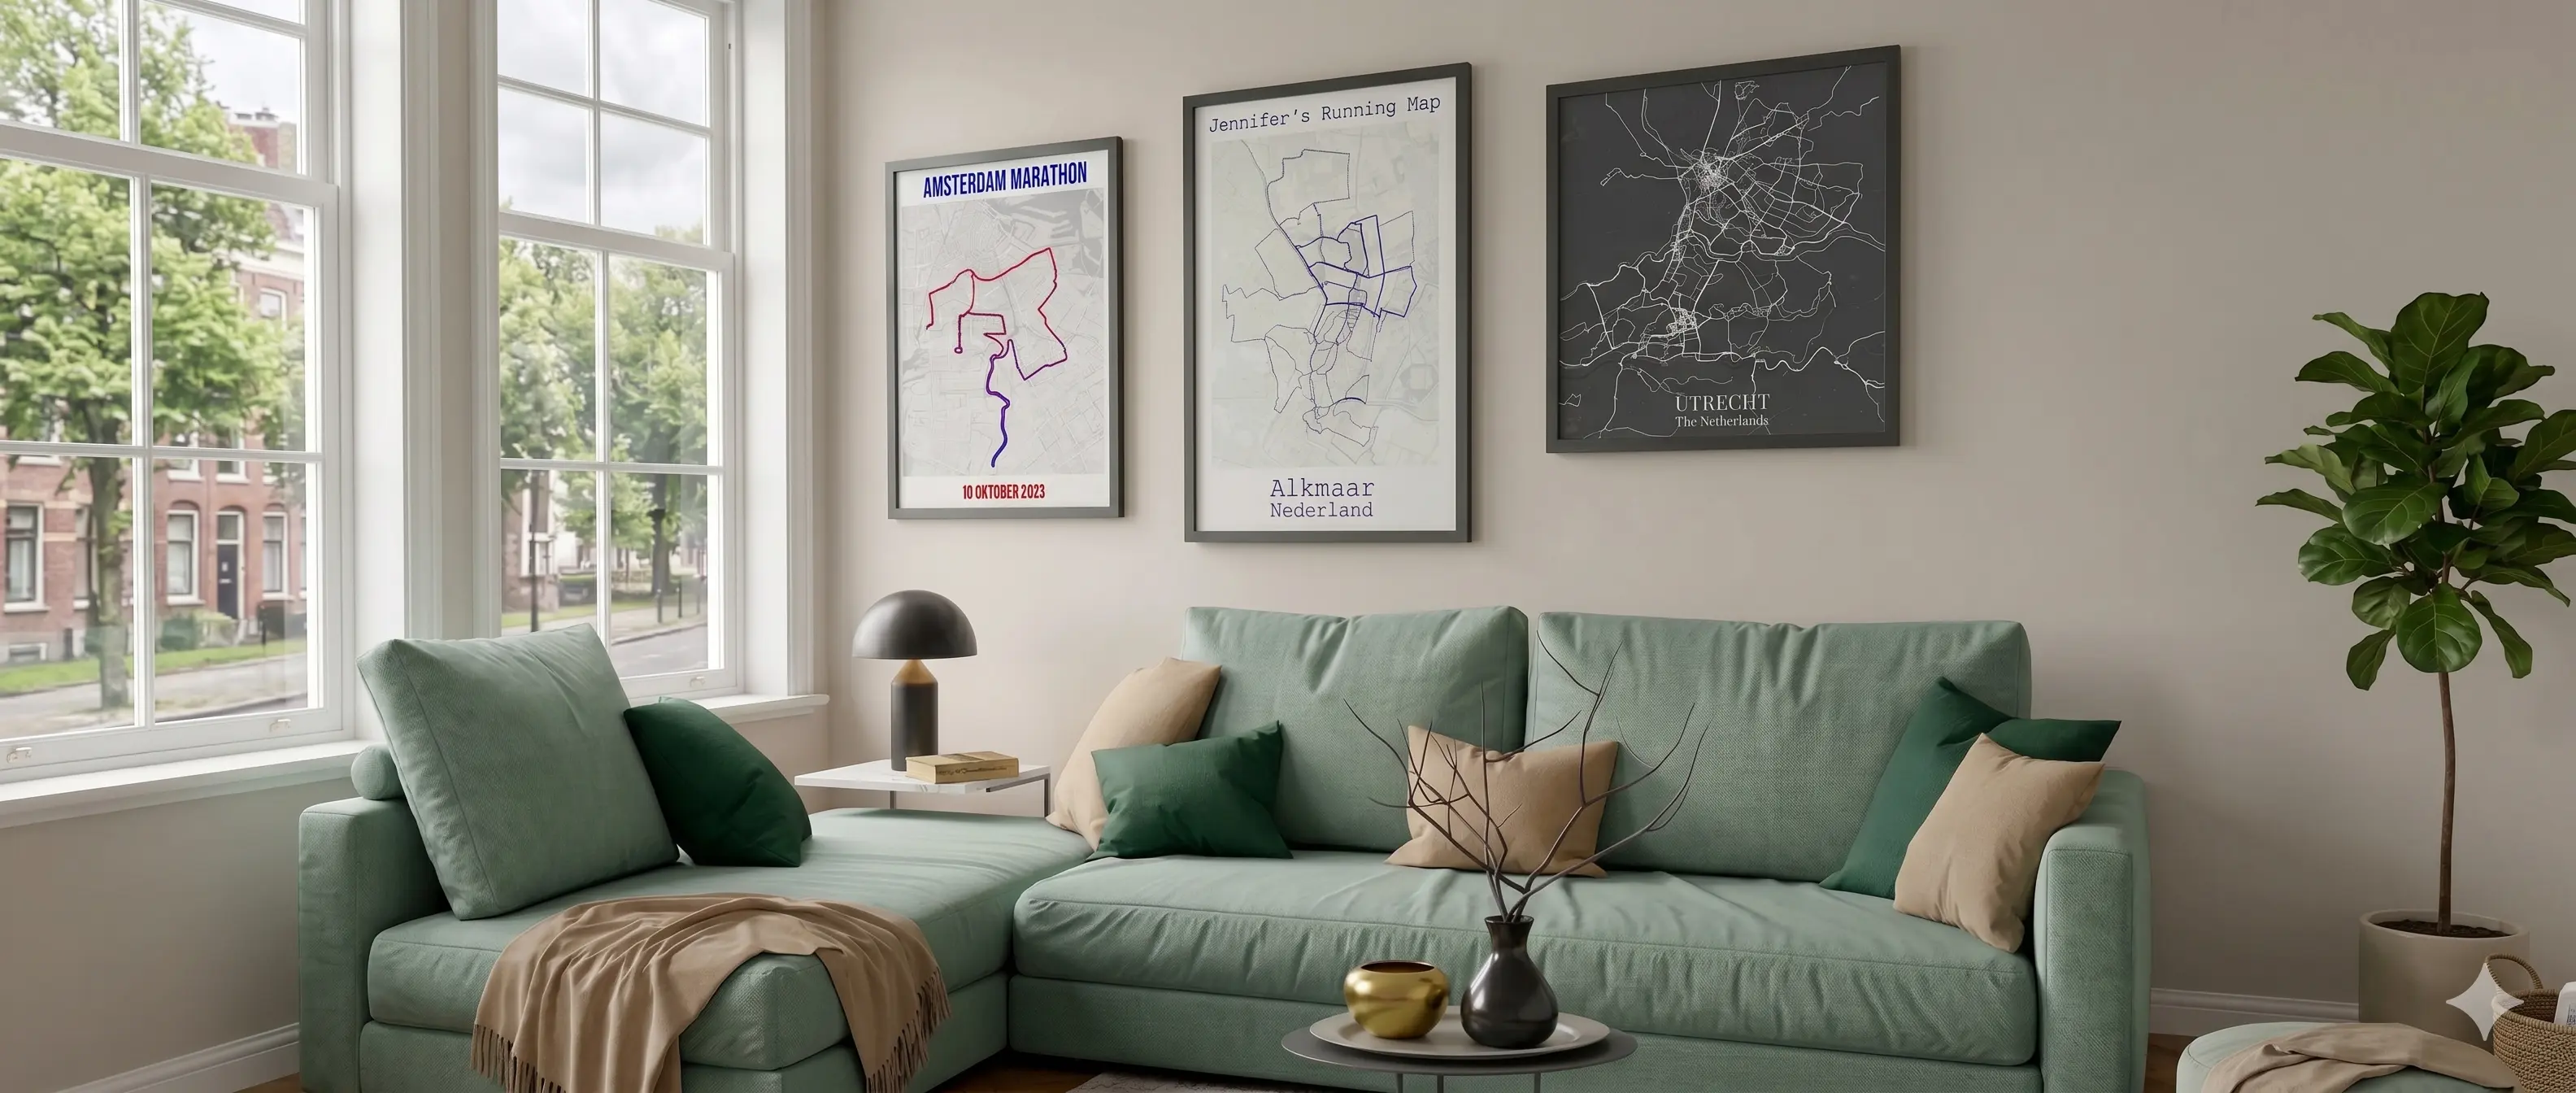
Laid out in the same five steps the editor itself uses: Activities, Map, Style, Product, Text, plus the extra tools (Graphs, Images, Highlights, Legend) available at any point. Includes the questions we get asked most: coloring a multi-day trip one day per color, building a poster from years of races, and what the two compass-shaped charts actually show.
None of it is really about the paper. It's about being able to point at the wall years from now and know exactly which day, which climb, which trip that was.
Just want to look around first? Click "Try Demo" on the start screen to load sample activities instantly, no upload, no Strava, no account needed.
Before you start
That's it. No design experience needed.
Don't have a file handy? Click "Try Demo" on the start screen to explore every feature below with sample activities first.
Step 1 · Activities
Upload files, connect Strava, or start from a race preset. Then pick which activities actually make the map.
Click "Upload Files" and drag your file into the upload zone, or select several at once (it's how you build a multi-day poster later, more on that under Style). The tool automatically pulls out the route, elevation, and timing. Have the wrong file type? Our free GPX/TCX/FIT converter switches formats in seconds, entirely in your browser. Not sure which format you have? See GPX vs TCX vs FIT.
For your own activities, authorize access and everything appears instantly with full data (more on what you can make from it on the Strava map print page):

Prefer a head start? Search your race in the "Use an Event Preset" box on the start screen and the tool instantly loads matching colors, fonts, and layout, no Strava needed. Browse them on the event presets page, including ready-made starting points for the Berlin, Boston, New York City, Chicago, London and Tokyo Marathons.
If you and someone else both use Strava, Together Mode combines both accounts on the same map, so the routes you actually rode or ran together show up as one shared poster instead of two separate ones. It's a popular gift for a partner or a regular training buddy: open the editor in Together Mode to try it.
Once your activities are in, the "Trophy Case" tab surfaces your best performances automatically: longest run or ride, largest elevation gain, fastest 5K, 10K, half or full marathon, most recent century ride, or the last 12 months as a heatmap. Click any trophy to load it, no scrolling needed.
Switch to "Manual Selection" for full control: a filterable list with date range, sport type, and All On/Off toggles, so you can find and pick exactly the activities you want, however many there are.

One activity selected unlocks per-route features: an elevation profile graph (auto-enabled above 100m of gain), gradient coloring based on your own data, and smart text suggestions built from that activity's stats. This is the natural mode for a single race like a Berlin or Amsterdam Marathon.
Several activities selected switches into heatmap mode: an overlay showing training patterns, favorite loops, or (covered under Style) a color per day, per year, or per sport.
No. Upload a GPX, TCX or FIT file exported from any watch, bike computer or app, no account or login at all. Strava is just the faster route for your own activities.
Yes, the upload zone accepts a multi-file selection or a multi-file drag-and-drop in one go. This is exactly how a multi-day trip gets built: one file per day, uploaded together.
Yes, that's Together Mode: two Strava accounts combined on one poster. Open the editor with ?mode=together to start one.
Trophy Case is automatic: it scans your connected activities and surfaces your personal bests for you. Manual Selection is the full, filterable list for when you know exactly which activity or activities you want and would rather search or scroll than let the tool guess.
Yes. The upload path doesn't care which brand made your watch or bike computer, only that it can export a GPX, TCX or FIT file, which covers virtually every fitness tracker on the market.
Step 2 · Map
The map style and border live together in this step, both instant to preview.
Each preview shows exactly what you'll get, and the map updates the instant you click a new one.

Enable "Border" for a photo mat around your map, a framed, gallery-ready look. It's more than on or off: pick the border's color, then drag its edges directly on the poster to make it thicker on one side than another, the way a real picture mat is often cut.
There's no wrong answer since every style previews instantly, but as a starting point: Light or Color for a minimal, modern look; Terrain or Relief when the landscape itself is part of the story (a mountain climb like Alpe d'Huez or Mont Ventoux); Dark or Satellite for a bold, high-contrast poster.
Yes, each of the four edges is independently drag-resizable directly on the poster, so an uneven mat (more room at the bottom for a title, for example) is just as easy as a symmetric one.
Yes, the border sits above whichever style you've chosen, so it's independent of Dark, Satellite, WaterColor or any of the others. It's the border's own color, not the map's, that decides how it looks.
Yes, at any point, in any order. Switching styles doesn't touch your route colors, text, photos or highlights, so it's completely fine to pick a style last if you'd rather nail the colors first.
Step 3 · Style
This is where most of the new functionality lives: 15 coloring modes in total, a full gradient editor, and an automatic legend. Easiest to follow along with the editor open in a second tab.
Choose "Color" and pick any shade. Adjust Line Width and Opacity to get the effect you want, especially useful once several activities overlap and you want the busiest streets to naturally look brighter, the basic building block behind a cycling route poster.
Solid color, six gradient shapes, five ways to color by your own data, and four ways to color by structure. Anything your file has no data for is grayed out automatically rather than hidden, so you always see what's possible once you add the right kind of file. The rest of this step walks through everything that isn't just "pick a color and go."
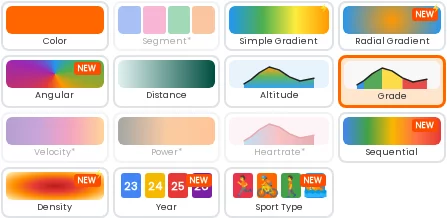

This is where the tool shines for a single recorded activity, detecting what your file contains and offering smart coloring for it:
For a hilly file the tool auto-selects Grade the moment you select the activity, so this often needs no input at all, on a Boston or Tokyo Marathon just as much as a mountain stage.
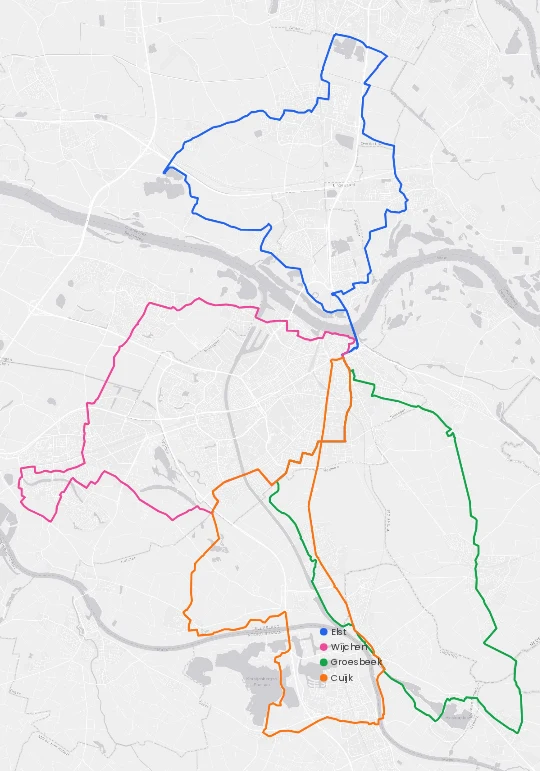
Upload each day of a trip as its own file, select all of them, then choose the Segment coloring mode. Every day gets its own solid color, drawn in the order the days happened, and a legend listing each day's name is added automatically, so nobody has to guess which color is which.
It works the same way for one file that already contains several days or laps as separate track segments: Segment colors each one individually instead of blending them into a single line. Upload a flat multi-day file like that and the tool even switches to Segment on its own, since there's no meaningful elevation to color by instead.
Built for:
People usually build this one for a reason that has nothing to do with wall decor: a parent's retirement hike, the week the whole family walked together, a trip nobody in the group will forget. The four colors aren't a design choice so much as a way to keep each day of the story separate on the wall, which is exactly why it also makes a present that lands differently than most: it's their own trip, not a generic gift.
Real examples: the Nijmegen Four Days Marches poster (four walking days in blue, pink, green and orange) and the Bikepacking Adventure Map (the same idea, one color per riding day).
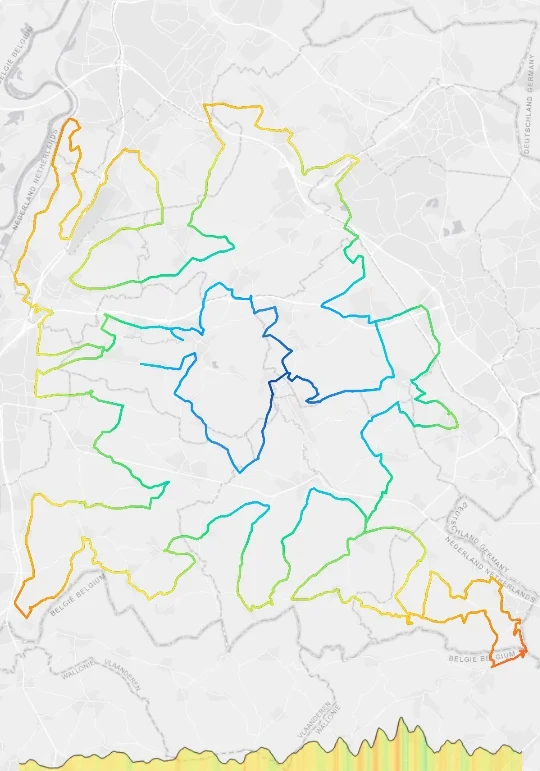
Colors each point of your route by its distance from the center of the map, so the route reads like rings radiating outward from a single focal point. Built for a loop that circles back near where it started, like the Amstel Gold Tour shown here.
Colors each point by its compass direction from the map's center, a sweeping pie-wedge effect. Built for routes that fan out in different directions from one hub, the same Amstel Gold loop turned into a completely different poster from the exact same GPX file.
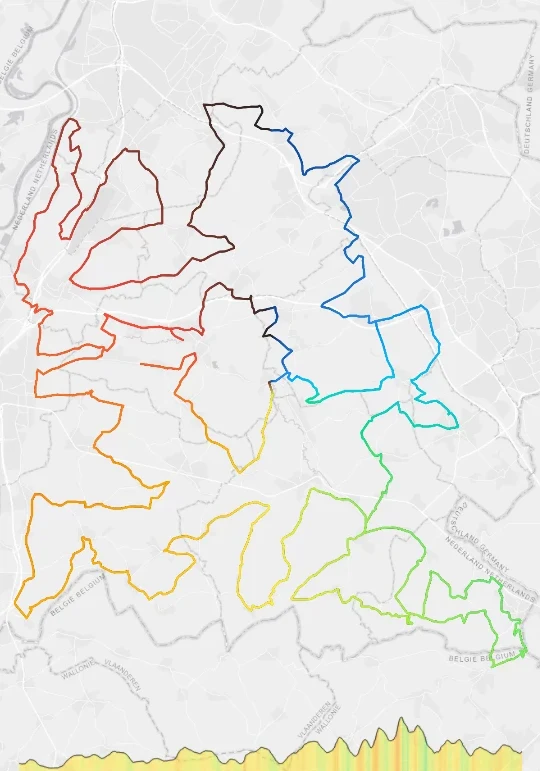
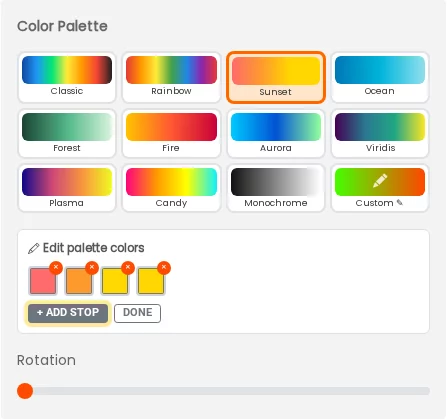
Every gradient mode pulls its colors from a palette you can fully edit. Hover a preset for a reverse button and a pencil icon: reverse flips the color order in one click, and the pencil opens an editor where you can change any color stop, add new ones, or delete stops you don't want.
Presets like Viridis and Plasma (borrowed from data visualization, chosen because they stay readable if someone is colorblind) come built in alongside playful ones like Sunset, Candy and Fire.
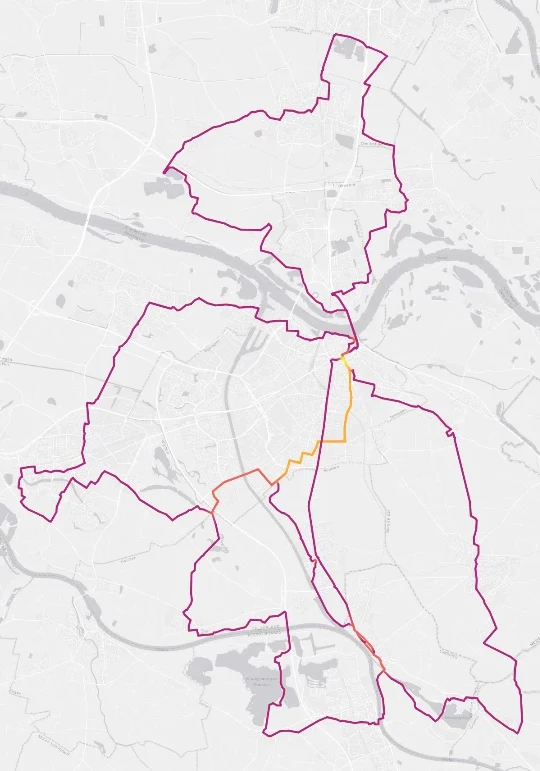
Colors each area of the map by how many of your selected activities actually cross it, so a start-finish street you've covered four times lights up differently from a stretch you only walked once. The map below is the Nijmegen Four Days Marches trip again: the shared start and finish streets glow, the individual day loops fade out. This is the closest the tool gets to a classic Strava Heatmap Poster.
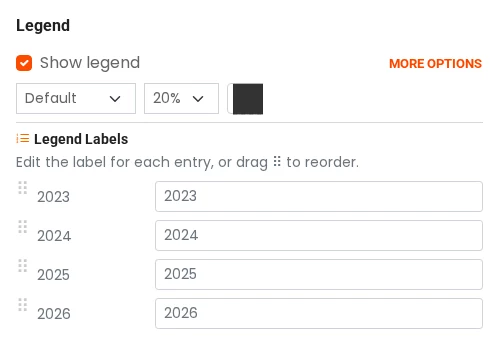
Colors every activity by the calendar year it happened in, one color per year, auto-assigned and individually renameable and recolorable in the legend afterward. Precisely what a Year in Sport poster needs, whether that's four years of the same race or a decade of scattered ones.
Colors every activity by its sport (run, ride, walk, swim and more), each group with its own color and a legend label you can rename, so "Ride" can become "Sunday long rides" if you'd rather. Exactly what powers a Multi-Sport Adventure Poster, and works just as well for a single triathlon or Ironman with its three disciplines colored apart.
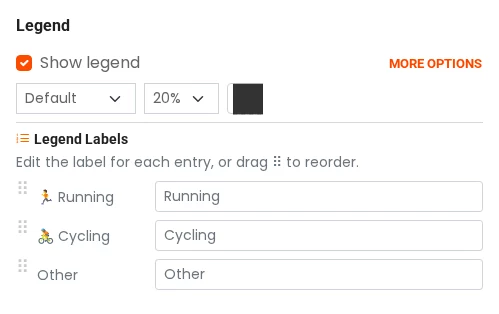
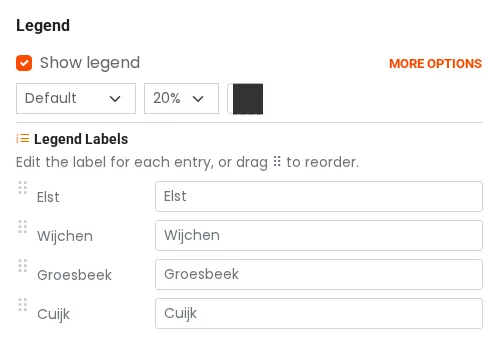
Switch into Segment, Year, Sport Type, or any gradient mode and a legend switches itself on, so a Year or Sport map is never just colors without a key. Every label is editable, rows can be dragged into whatever order tells your story best, and the box itself is fully styleable: font, size, color, bold, italic, even a soft glow. Like every other element on the poster, it's draggable and resizable too.
Upload each day as its own file, select them all in Step 1, then pick "Segment" in Step 3. Colors and the day-by-day legend are added automatically.
Sequential is a smooth gradient by exact date, oldest to newest, good when the progression itself matters. Year buckets activities into one solid color per calendar year, good when you want a small number of clearly named groups rather than a continuous fade.
Altitude, Grade, Velocity, Heart Rate and Power all need that specific data in your file. A GPX without elevation, for instance, will gray out Altitude and Grade rather than hide them, so you can always see what's possible if you add a richer file later.
No, one coloring mode applies at a time, so it's Segment or Grade, not both at once. Nothing stops you from making one version of each and comparing them side by side before you decide, since switching modes is instant.
Yes, every legend row has an editable text field, and the rows themselves are drag-to-reorder, so you can put the most important day, year or sport wherever it reads best.
Altitude and Grade gray out, but everything else still works: solid color, all six gradient shapes, Segment, and the multi-activity modes. A flat multi-day file with no elevation is actually the exact case where the tool auto-switches to Segment for you.
Step 4 · Product
Every size and price is a live preview in the editor, nothing to guess at.
A free low-resolution download is always available to keep or share online, sent straight to your email. The high-resolution digital download (a print-ready 300dpi file) is the most popular option, and the Poster tier ships an actual print. Each size shows its own price as you switch, and portrait or landscape is a toggle away for every size except the square formats.
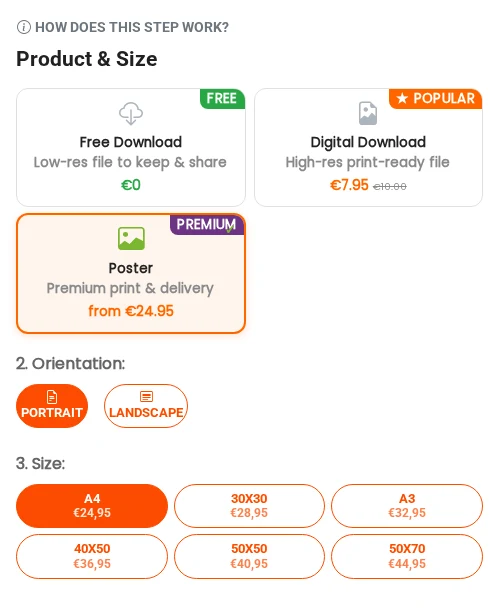
A4 works for a desk or a small gallery wall, 30×30 or A3 for a shared living space, 40×50 and up for a statement piece. Every size previews live before you order, so it's worth flipping through a few before committing.
The digital download is the exact same design as a 300dpi file you print yourself, at any shop, on any paper. The Poster tier is that same file printed for you on premium paper and shipped, so it's really a question of whether you want to handle printing or not.
Yes, prints ship to most of Europe, the UK, the US, Canada, Australia, New Zealand, Japan and South Korea, from a local printing partner close to the delivery address. Digital downloads work anywhere, delivered by email the same day.
Step 5 · Text
Click any text field for smart suggestions built from your activity data. Drag and drop:
Everything is calculated from your data, so there's no typing distances or elevation by hand, useful right down to a single Father's Day or Mother's Day gift line.
A large bold Map Title plus three Bottom Text lines for stats or a custom message. Leave any blank for a minimal look, or fill them all in.
Added several text elements? The Align Left, Center All, and Align Right buttons line them all up in one click instead of nudging each one by hand.
No. A blank field just doesn't render, so a title-only design is as valid as one with a title and three stat lines.
Yes, the Align Left / Center All / Align Right buttons apply to every text element at once.
Yes, the suggestions are just a shortcut. Every text field is a normal editable field, so typing your own title, a nickname, or a message for a gift works exactly the same as dragging in a suggestion.
The Map Title and three Bottom Text lines are it for body text, but Highlights add their own labels anywhere on the map, so a start/finish name or a landmark note doesn't have to compete for one of the four slots.
Available at any time
Four more panels sit outside the numbered steps, reachable whenever you need them rather than in a fixed order. All four live in the icon strip along the top of the editor.
For activities with real elevation, an elevation profile graph is added below your map automatically, colored to match your route, toggleable for any activity.
Add race photos, summit selfies, or logos, then position and resize them on your map for a personal touch.
Want your own photo as the background instead of a route on a street map? Turn on "Lock Map Position" first, so dragging and pinching moves the photo instead of panning the map underneath it.
Type a city name and pick it from the live search to drop a labeled pin exactly there. Or click "Add Highlight" for a plain pin at the map center, then drag it anywhere, rename it, and give it one of twenty icons: start, finish, viewpoint, food stop, photo spot and more.
Every pin recolors on its own, with font, text size and pin size applied globally so a whole set stays consistent. This is exactly how the day names on the Nijmegen Four Days Marches poster and the switchback labels on the Tour de France climbs posters are built.
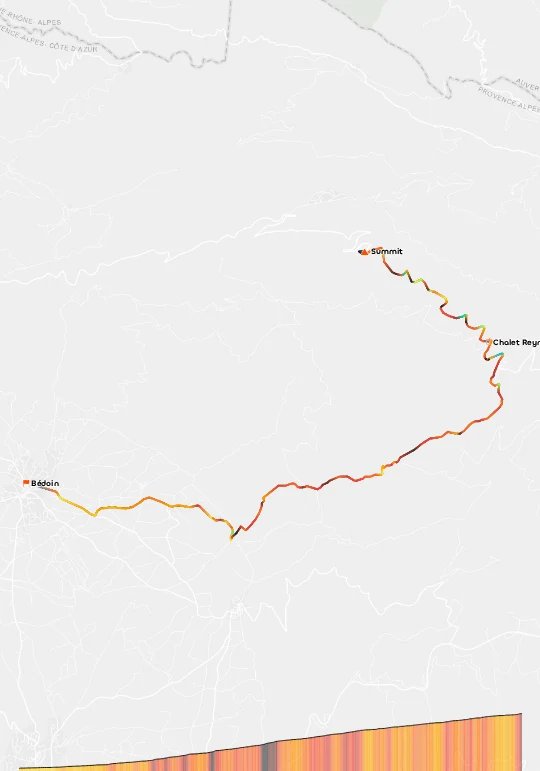
Just real GPS coordinates and timestamps, nothing extra to log. Worth turning on even for a file you weren't expecting much from.
Under Highlights, click "Add Highlight," drag the pin into place, and pick the matching icon from the twenty available.
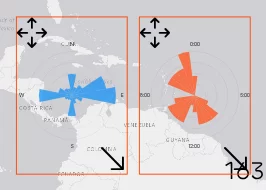
Yes, every one of them, the elevation profile, both roses, the legend, and every highlight pin, is draggable and resizable directly on the poster, so nothing has to stay where the tool first puts it.
As many as make sense for your route. Most posters read best with somewhere between three and six, enough to tell the story without the map turning into a pincushion.
Done
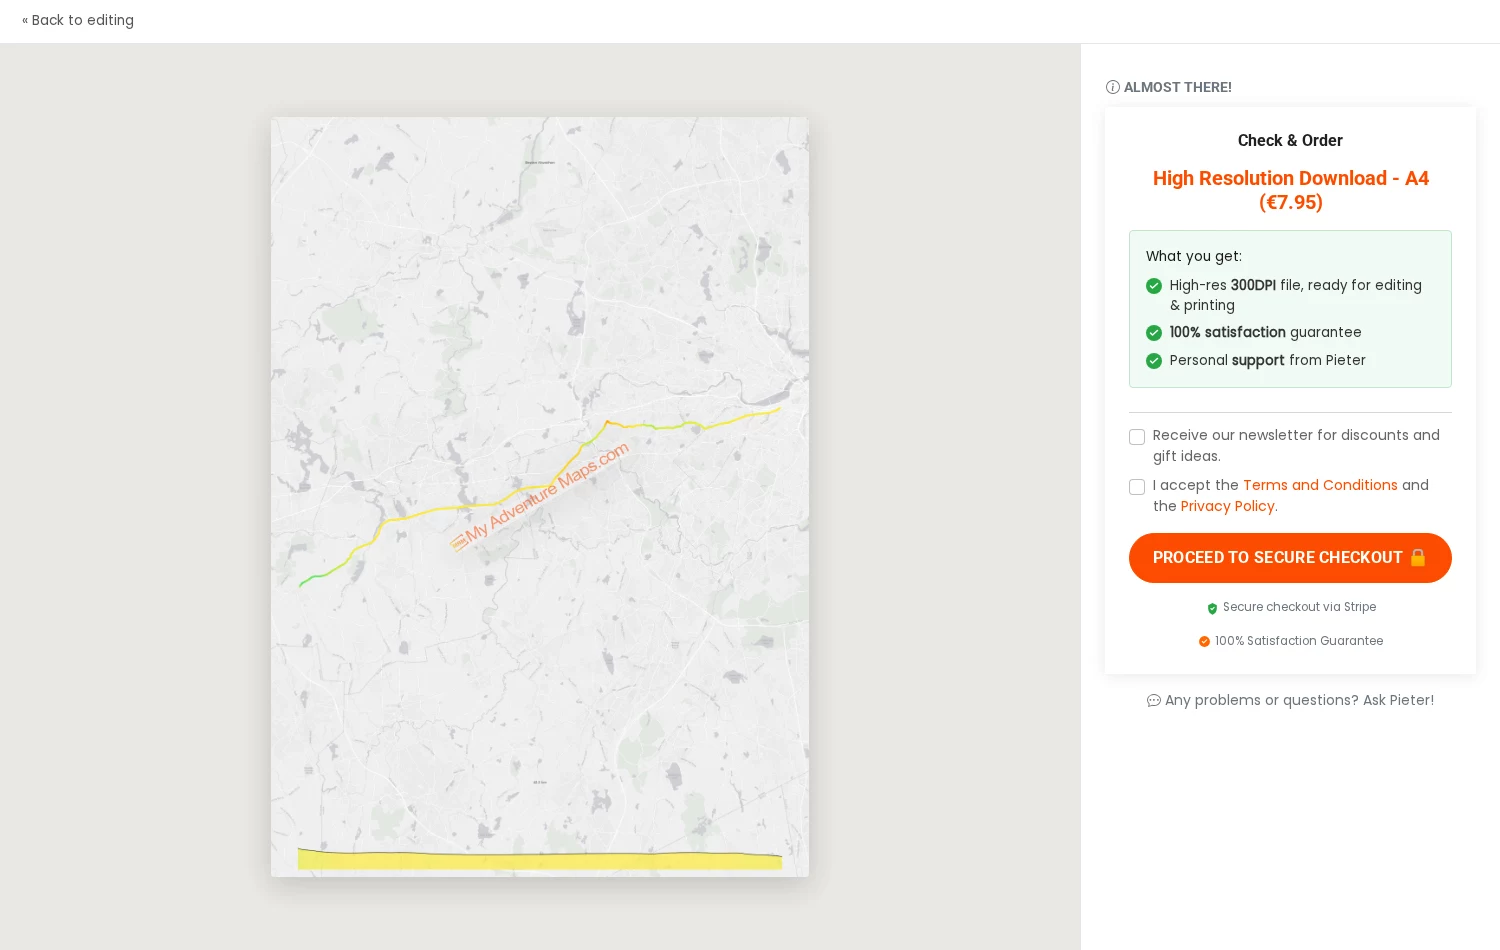
Click "View your map" for a preview screen: your finished poster on the left, with a watermark that only appears here and won't be on the file you actually receive. Confirm product and size on the right, then continue to a secure Stripe checkout. For the free tier, there's no payment step at all: the low-resolution file is emailed straight to you instead.
You now know every option, from a single-color route to a five-day trip with its own legend. The tool handles most decisions automatically, so you can spend your time on what actually matters: keeping the trip, not just the paper.
View your map! →Questions? Email pieter@myadventuremaps.com, we're here to help.
New features, map styles, and discounts, about once a month.
